Standing knee-deep in a river and dying of thirst.
Joe Cocker
As I’m writing this, we’re at the end of our election cycle in the US. For months, we’ve been bombarded with snarky snippets aimed at getting us to vote against the other guy, not for somebody. No matter our political affiliation, I think we all sometimes feel we’re in a river of factoids, looking for the truth.
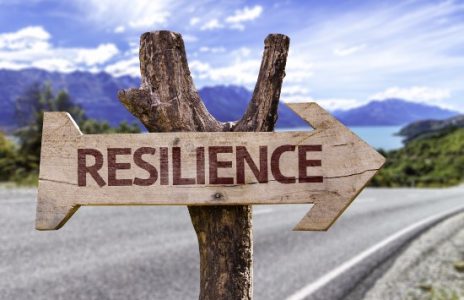
The same thought applies to community resilience. Since I began working in the field, we’ve seen an explosive growth in the knowledge base. Unfortunately, this has not been matched by the application of the knowledge in practice. There are several reasons for this:
- Accessibility. Much of the knowledge base is captured in academic journals that are never seldom read by anyone other than academics; and even if read, academic jargon
and the creep of politics into much of the social science literatureturns off many practitioners; - Lack of a framework. There isn’t a generally accepted theory of resilience that ties the many disparate strands together;
- The resilience to __ problem. Practitioners are most often interested in strengthening specific domains and mitigating specific threats, not something as nebulous as fostering a community’s resilience (i.e., practitioners are most interested in the resilience of X to Y). Much of the literature treats resilience as an inherent attribute of a community, ignoring specific threats;
- Lack of community-specific information. While there are several excellent presentations of data at the state or county level (e.g., Susan Cutter’s maps), there is much less at the level of individual communities;
- Need to “kiss a lot of frogs.” There is so much information out there (and more being published daily, it seems) that finding that one key paper that will unlock the door to desired solutions requires time and effort that
nofew practitioners have.
Three years ago, Brian Dabson introduced me to an approach he was developing for the Missouri Transect Project. At the time, I was immersed in the ANCR Benchmarking effort, and – although I praised the overall conception and sent him some suggestions for making it better – I essentially forgot about it. At almost the same time, he left Mizzou for North Carolina (as good an excuse as any to not follow up on my “helpful” suggestions!) and his erstwhile co-workers appear to have dropped the approach as well.
Three months ago, I was asked to consider how to provide meaningful measures for the resilience of small communities, especially in rural areas. I expanded my writ a bit by looking at Opportunity Zones as well. In going back through all of the material I’ve accumulated, I stumbled across Brian’s excellent work. Below, I present my adaptation of Brian’s approach (with apologies to him where I’ve strayed from his original conception). The approach is intended for use by practitioners to determine where to invest scarce community resources.
The concept is deceptively simple. It starts with the concept that the purpose of a community is to carry out common functions for the members of the community. In general, the business of the community – carrying out its common functions – is performed through the consumption and production of community capital – financial, human, social, institutional. Thus, one way to look at a disruptive event is as a disruption of a community’s normal pattern of transactions (thanks due to Dan Alesch for this idea). Recovery then means establishing a new pattern of transactions, i.e., a New Normal. This enables us to assess a community’s resilience in terms of capital – its capital at risk vs the dispatchable capital available for recovery, from a given disruptive event. Examples of fixed and dispatchable assets:

Disruptive events might be natural disasters, or economic crises, or the return of the coronavirus. As discussed in a previous post, the “weaknesses” at the potential point of attack corresponding to the threat comprise the susceptibility. Generally speaking, these are the weaknesses of fixed assets to the threat’s attack. An attractive feature of this approach is that it can be applied to a community system (e.g., housing, water), a neighborhood, or an entire community.
One of the thing that I found very attractive in Brian’s original concept was the way he treated indicators for both susceptibility and recovery. For the Transect Project, he converted each indicator to a value between 0 and 1, by dividing by the range of values. As is generally done, he took the average of sets of indicators to come up with overall values for susceptibility and recoverability. An unintended consequence of this is that this enables us to use qualitative data as well.
For example, if we’re interested in the recoverability of a community’s electric power system, we might have quantitative data relating to financial reserves of its power authority. We might not have quantitative data on its susceptibility to a natural disaster, but through survey data or other means we could come up with a “good, bad, indifferent” rating which we could fuzzify onto a 0 to 1 scale. We then plot recoverability (Y) vs susceptibility (X).
This approach can be usefully applied in several ways. For example, it can be used to look at several threats to determine where to put mitigation dollars. In this figure, I’ve notionally looked at flooding, a health crisis and an economic crisis for a community. For susceptibility to flooding, I would include the condition of houses and other structures, and FEMA flood zone information (for both, there are useful quantitative and qualitative indicators). For recoverability, I would look the fraction of residents living in poverty, whether there were sufficient construction professionals. I would do similar things for the other disruptive events. The results might then look like

In this case, it appears that it might be more useful to invest in mitigating a health care crisis. While there is slightly greater susceptibility to an economic crisis, recovery from a health crisis is much less certain. While recovery from flooding is also “iffy,” a damaging flood is much less likely. Miami provides a real-world example of the latter. Many of the poorer sections of the city (i.e., those with less resources for recovery) are built on higher ground (i.e., less susceptible to flooding).
This approach can be used in other ways as well. For example, flood mitigation funding for Miami might better be used in those low-lying areas with the lowest incomes; i.e., the approach can be used to determine where best to use targeted mitigation money. Similarly, the approach can also be used to determine how to invest. In this case, the different indicators for recovery are compared, as are those for susceptibility. Those that most greatly increase the distance from “red” to “green” are those most likely to have an impact. But since there are costs associated with any action, communities will most likely want to do a “distance / dollar” type calculation. In my next post, I’m going to look at a method a community can use to determine what resources are needed for recovery.
I like this approach for several reasons:
• First and foremost, it is visual. There’s not a lot of numbers or complicated words for the layman to try to understand. If you’re in the red, you want to get in the green.
• Unlike the other common visuals – maps, I can look at how well my community (or my neighborhoods, or my water system…) will handle all of the threats I’m worried about. This makes it easier for a community to prioritize its investments.
• Because I’m looking at all of the community capitals, I can also consider the impact of non-financial investments, and of investments made by all parts of the community. It allows the local government to look at the impacts of investments made by non-profits, businesses, and of “capital stacks” on recoverability. For example, if there were insufficient construction professionals, a partnership could be formed between construction companies, local unions and a community college to begin to fill the need.
• Finally, its extensible. As we learn more about how communities actually recover, and the relative importance of various factors to susceptibility and recoverability, we can add factors or throw out others or learn how best to combine them.
My goal – as always – is to find ways to help communities strengthen themselves. Knowing which strengths are relevant to a community’s ability to withstand or recover from the threats it faces is a crucial first step. That knowledge is the key to taking action to become a stronger – more resilient – community.

One thought on “Visualizing resilience”